Fee Optimizer for Dentists
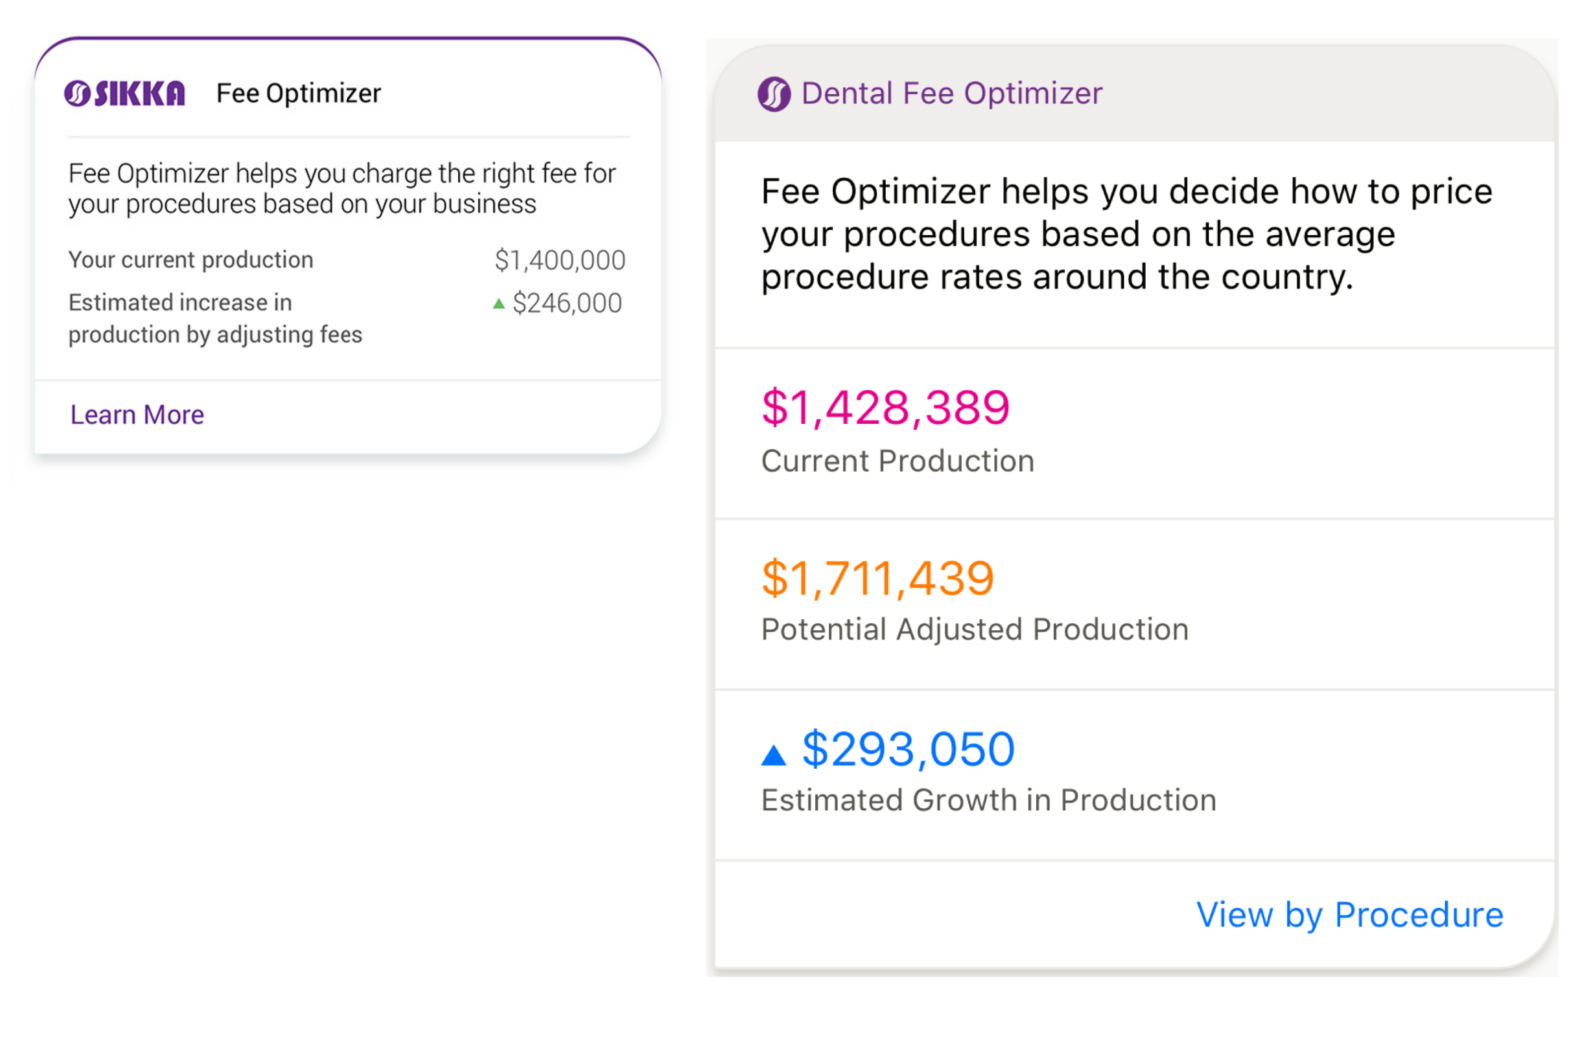
PrintFee Optimizer is a powerful tool that allows you to quickly view all your fees for procedures that have been performed, as well as production values for any date range.
In the Practice Mobilizer smart phone App, you can refresh the data twice in one year per annual subscription. You can also have the report emailed to you by clicking the Get Full Report link in the App.

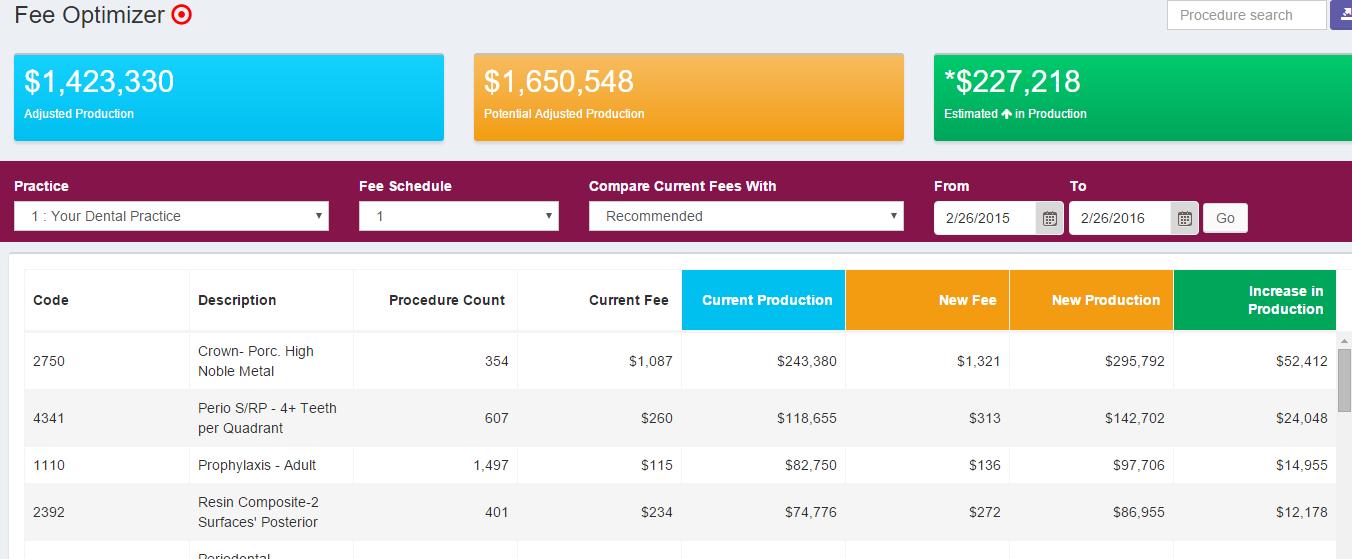
In Optimizer Classic, you can sort the list view in Fee Optimizer by clicking on any column header, such as Procedure Count or Current Production to arrange the entire report by that value. Fee Optimizer allows you to quickly see the items that are most frequently invoiced or which generate the most production.
By default, Fee Optimizer uses one year’s (last 12 months) production data, and analyzes several data sources to calculate recommendations.
***Note: The top 3 boxes are indicating your adjusted production (which looks at your total gross production charges, less any adjustments made against those charges in your Practice Management Software). The Current Production in the list view (below) is referencing your gross charges for the number of procedures performed - and does not consider adjustments made against those charges in your Practice Management Software.

What is the New Fee?
The New Fee is a recommendation. Fee Optimizer does not position the New Fee as a requirement for any practice to implement. As always, the final word on updating the fees rests with the owner/doctor because he/she is the final decision maker. When a patient walks in the door, the owner/doctor is responsible to explain his fee to the patient.
Where does the New Fee come from?
These New Fees are based on your practice “style” - which means you could be on the higher percentile for your fees when comparing geographically, but may be the top performing practice in your area for that specific procedure. Two main factors are the frequency of procedures and the profitability of those procedures. Fee Optimizer aligns the two factors and brings them as close as possible to display the New Fee. Keep in mind, a particular code could be the most frequent procedure transaction, but it can't be the most profitable because it may effect a practice's supply-demand balance (Prophy's for example). That's why bringing frequency and profitablity into an "optimized" New Fee is essential.
Note: These two factors will never be in perfect alignment, but Sikka brings you the best and most optimized New Fee based on those two factors. The result is a New Fee that doesn't follow a guideline of percentile rankings alone, but rather optimizes fees to maximize a practice's profitability. Other secondary factors effecting the two are: procedure mix, duration of appointments, number of providers, provider types, lab fees, number of operatories, and more…
Sikka provides the best, most relevant, comprehensive and accurate fee data guidelines which will always reflect the macro and micro economic conditions in and around your practice.
What if I mostly take insurance patients, and very little/no cash patients?
Sikka’s fee data is based on Provider (UCR/Office Fees) charges, NOT Payor (Insurance Fees) payments. If you take mostly insurance you can still use Sikka’s fees. By submitting your UCRs to your Insurance Payors, you can influence the updating of what they pay in some cases. If 25% of your patients will be cash patients (after insurance runs out, and through co-pays) your practice can still increase profitability by as much as 20% in the next 12 months using our New Fee guideline.
Our PPO Comparison Report is a great tool to use in tandem with Fee Optimizer.
Where does the percentile fee data come from?
Sikka has one of the largest samples of fee data in the U.S. We have collected fee information through 7 major sources:
- Surveys (such as the national and state dental organizations)
- ADCPA and local state and county level fee surveys
- Dental Economics - Sikka fee survey
- American Dental Sales fee survey
- Our own list of 52,000 dentists that we periodically get fee surveys from
- Cost of Living (COLA) and US Department of Census databases such as Data.gov
- Our own list of over 13,000 opt-in installations that are refreshing data every morning
Based on this, Fee Optimizer has over 55,000 dentists and thousands of zip code level information sources. Our fee database is sourced by over 42,000 zip codes. In the US there are about 49,000 zip codes. This all means that Sikka has one of the most comprehensive fee databases in the industry.
How is Sikka’s fee data different from other fee schedules?
Most other fee surveys you receive from somewhere else usually only source 2,000-5,000 dentists and use only 3 digit geo zip sources. They also include geo multipliers in their calculations.
For example, if you’re in San Diego your fees may be averaged out with every other practice in your region, and then multiplied by the geo multiplier of 1.2 for the recommended fee; but if you’re in Kansas City that geo multiplier is only 1. Basically you are getting averaged out by your geographic data alone, and then the geo multiplier is determining your new fee.
Fee Optimizer includes 55,000 dentists, and we use the full 5 digit zip code in our logic. If our survey doesn't find enough dentists in the 5 digit zip code, it follows a funnel shaped analysis and goes to a zip (3 digit) and then to county level if necessary.
I don’t want to lose patients by updating my fees... What can I do?
Most dentists think that they are the best paid dentists in their area. However, 99.99% of dentists are not the best paid. There are always dentists who are charging more than you. If you’re afraid you’re already are at the highest percentile, rest assured it is just an artificial ceiling. Simply put, if you are the best performing dentist in your area, then you should be the best paid dentist in that area.
In addition, rules of price tolerance are such that if your patient can bear the update in fees, then you should charge those fees. Sikka’s customers have never seen patient attrition more than 2% after a fee update. Of the patients who do leave, statistically they are those who will call around to find out who charges $20 less for crowns… frankly those are not the loyal patients that you need in your practice.
A Gary Takacs study that showed that if your overheads are 65%, and your fees are updated 10%, your practice would have to lose about 30% of its patients to realize the loss of profitability.
Please review the supplemental articles we've included here for further strategies and best practices regarding evaluating and setting your fees (attached below).
How often should a practice evaluate/update their fees?
To stay abreast of costs and maintain practice profitability, a practice should review their fees at least twice per year. In the current ever changing economic environment, it is a good practice to review and analyze fees on a quarterly basis. This helps practices remain competitive and profitable at the same time.
A practice that has been in business for many years should not want to set their fees too low and risk undermining the value of their work. Practices that use high end labs, state-of-the art diagnostics, and other technology etc., need to ensure that they are profitable. A practice that is just starting does not want to set their fees too high which may result in driving patients away.
For more information on Fee Optimzer, watch this video from Sikka CEO Vijay Sikka:
- Willeford article on fees - 2011 09.pdf
- The Science of Setting Fees.pdf
- Farran on Fees.pdf
- Kodak Study.pdf
%20(1)-1.png?height=120&name=sikka%20email%20logo%20(1)%20(1)-1.png)